
Operational Metrics: Capacity, Coverage & the AE:SE Ratio

TL;DR
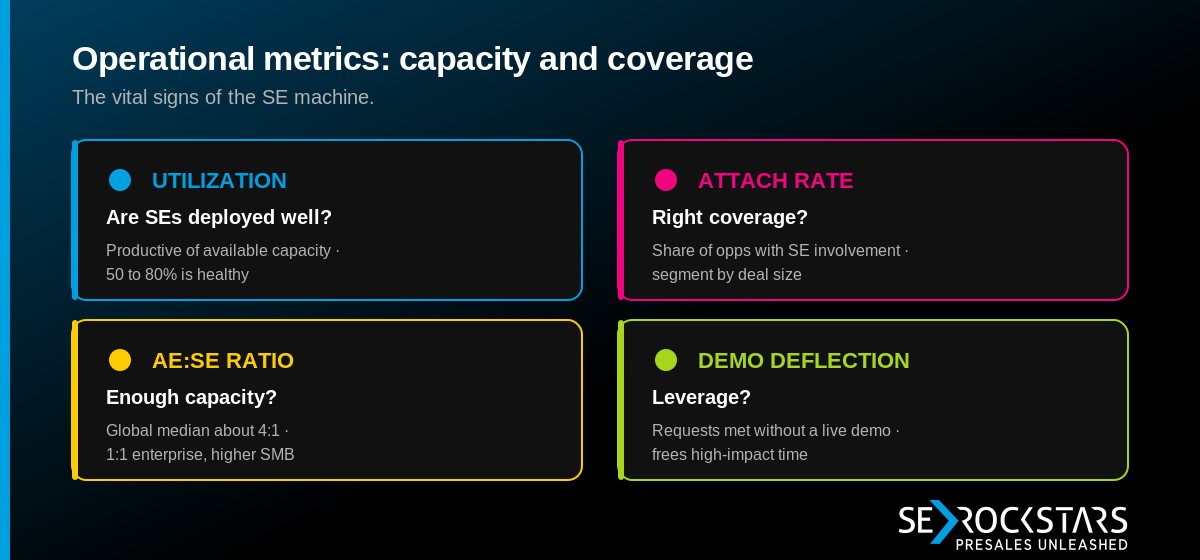
- Operational metrics are the vital signs of the SE machine: they tell you whether capacity is deployed well, before burnout and coverage gaps show up as missed deals.
- The headline number is the AE:SE ratio — the global median sits around 4:1, but enterprise coverage often runs as tight as 1:1, and a single blunt ratio is the wrong way to set headcount.
- The metrics that actually matter for capacity planning: SE Attachment Rate, Utilization, SE Request Volume per AE, Active Deals per SE, and demo deflection.
- Used alone, these are "vanity metrics." Paired with outcome and quality signals, they become the early-warning system that keeps a team from quietly grinding itself out.
- The goal isn't to look busy. It's to build a support model that scales without breaking the people in it.
One SE leader at an enterprise ERP company in North America described the moment most PreSales leaders dread — walking into a headcount conversation armed with the wrong unit of measure. "I was unsuccessful in defending headcount when our company's view was purely a 1:3 AE-to-SE ratio," he told us. "When I positioned a big spreadsheet covering multiple metrics — including the fact that if you factor in the post-sales team, the effective ratio is more like 1:7 — it still didn't win."
Read that twice. He had data. He had a more honest ratio than the one being used against him. And he still lost — because the organization had already decided that one number, the AE:SE ratio, was the whole story. That's the trap of operational metrics. They're the easiest KPIs to collect and the easiest to weaponize. This part of the series is about using them properly: as the pulse of the machine, not as a blunt instrument for cutting heads.
What are operational metrics in PreSales, and why do they matter?
Operational metrics measure how SE capacity is deployed — workload, coverage, responsiveness, leverage. They answer a different question than leading or lagging indicators. Leading metrics ask "which deals will close?" Lagging metrics ask "what did we deliver?" Operational metrics ask: "Is the machine running at a sustainable pace, and is effort going where it should?"
They get dismissed as vanity metrics, and in isolation that's fair — "we did 400 demos" tells you nothing about impact. But that's not their job. Their job is to be the vital signs. A spike in activity volume signals capacity stress before anyone files a complaint. A drop signals a coverage gap or a drying pipeline. Watched together, over time, they tell you whether your support model is healthy or quietly heading for a crash. Ignore them and the first symptom you'll notice is your best SE handing in their notice.
What's the right AE:SE ratio for a B2B SaaS company?
Here's the answer most people want and the honest caveat that has to come with it: the global median is roughly 4:1 — one SE supporting four Account Executives — but the "right" number depends entirely on your coverage model, and a single ratio applied across the whole org is a planning error.
Lower ratios (down to 1:1, or even multiple SEs per deal) buy deep, dedicated coverage. That's what complex enterprise motions demand. Higher ratios (6:1, 8:1 and up) force a scaled, repeatable, self-serve-heavy motion typical of SMB and transactional mid-market. Neither is "better." They're answers to different go-to-market questions.
The reason a blanket ratio fails is that most PreSales teams aren't homogeneous. One SE leader at a vertical SaaS company in the DACH region put the spread perfectly:
"The goal is to make clear that PreSales is not just the demo monkey. Some people on my team present tools — someone calls in, says they need a CAD tool with certain capabilities, they show it quickly and hand out 20 licenses. But then we also have enterprise solutions where 3 or 4 people work together, a 3–4 year sales cycle, complex processes, and multi-week workshops at the customer site."
— SE Leader, Vertical SaaS company, DACH region
You cannot set one ratio for both of those worlds. The transactional tool-demo desk might run 8:1 comfortably. The enterprise engagement with a four-year cycle and on-site workshops might justify two SEs on a single account. Average them into one company-wide "4:1" and you'll over-staff the easy work and starve the deals that carry the number. Segment the ratio by motion — enterprise, mid-market, SMB — and it stops being a weapon and starts being a planning tool.
Which operational metrics actually matter?
Not all of them, and not all the time. Five carry most of the signal for capacity and coverage:
- SE Attachment Rate — What it tells you: % of pipeline / deals with SE involvement · Watch for: Too low = SE engaged too late; too high = SE on deals that don't need them
- SE Utilization — What it tells you: How much capacity is consumed · Watch for: Sustained >100% is a burnout flag, not a badge of honor
- SE Request Volume per AE — What it tells you: Demand each AE places on the team · Watch for: Outliers reveal overreliance or underuse — a coaching signal
- Active Deals per SE — What it tells you: Concurrent deals one SE carries · Watch for: Too many = shallow "drive-by" engagement; too few = under-utilization
- AE:SE Ratio — What it tells you: Top-level coverage model · Watch for: Set quarterly, segmented by motion — never one blunt org-wide number
Two of these deserve a closer look, because they're the ones that turn a vague "the team feels slammed" into something you can act on.
SE Request Volume per AE is quietly one of the most useful numbers a leader can track, because it exposes the enormous variance in how AEs use their SEs. Some AEs lean on the team for everything, including work they could self-serve — "SE-as-admin" behavior that burns capacity on low-value tasks. Others barely engage, then pull an SE in at the eleventh hour and wonder why the technical evaluation is rushed. Tracking requests per AE turns those instincts into data, and data turns a tense capacity conversation into a productive coaching one with the individual AEs who are mis-using the team.
Active Deals per SE is the burnout canary. An SE carrying too many concurrent deals doesn't fail loudly — they just go shallow on all of them. Discovery gets thinner, follow-up slips, the technical win takes longer on every deal at once. Read it alongside utilization and you can spot the overload before it shows up as a slipped quarter or a resignation letter.
The thing no operational metric captures on its own
Every metric in that table measures volume or load. None of them, by itself, measures whether the work was any good — and that's exactly how they get misused. An SE running at 110% utilization on twelve active deals looks maximally productive on a dashboard. They might also be drowning, doing twelve mediocre jobs instead of six excellent ones, and accelerating toward a missed number very efficiently.
So the rule for operational metrics is the same rule that runs through this entire series: never report a load metric without an outcome or quality metric beside it. Activity volume pairs with technical win rate. Utilization pairs with deal quality. Request volume per AE pairs with request complexity, so you can tell heavy-but-strategic demand apart from heavy-but-trivial demand. The number on its own is motion. The pair is meaning.
Demos: the leverage lever
Demos are where operational metrics turn into real, recoverable capacity. Four numbers matter:
- Total Demos Delivered — raw workload and demand trend.
- Demos per Deal — a process-quality tell. A high number usually means unclear success criteria or weak discovery, with "demo loops" standing in for decisions.
- Standard vs. Custom Ratio — your scalability dial. A high standard share means leverage and consistency. A rising custom share can be right in enterprise, but it has to be a deliberate choice, because every custom demo costs prep time and adds variance.
- Demo Deflection Rate — the share of demo requests satisfied without a live SE: recorded demos, interactive demo automation, sandboxes, product tours, partner-led demos.
Deflection is the one to obsess over. Every standard, low-complexity demo you can deflect to an automated or self-serve format is SE capacity handed back for the work only a human can do — discovery, technical validation, POCs, the enterprise engagements that actually move the ratio math. In the right segments, deflection is how you raise effective coverage without adding a single head. It's the most honest way to answer "do more with less" without grinding people down.
Why this matters: capacity you can't see, you can't defend
Operational metrics aren't just an internal hygiene exercise. They're the evidence base for every headcount and resourcing conversation you'll ever have — and without them, you walk into those rooms empty-handed. One SE manager at a cybersecurity company based in the DACH region put the stakes plainly:
"I think that's important, because otherwise you can't demonstrate the effort you're putting in. They need to see it, essentially."
— SE Manager, Cybersecurity, DACH region
That's the whole case for instrumenting capacity. When the budget review comes, "the team feels stretched" loses every time. "Our enterprise segment is running at 1:1 coverage, utilization has sat above 100% for two quarters, and active deals per SE is up 40% year over year" is an argument. It's also, notably, more than a ratio — which is exactly the lesson the ERP leader learned the hard way. He lost his headcount fight not because his data was wrong, but because the organization had locked onto one number. The fix isn't a better spreadsheet. It's a coverage model, segmented by motion, backed by a handful of operational signals that show what the work actually costs and where it's quietly breaking.
Build that, and the AE:SE ratio stops being the thing that's done to your team — and becomes one input among several that you control with data.
Frequently asked questions
What's the right AE-to-SE ratio for a B2B SaaS company? The global median is around 4:1, but treat that as a starting reference, not a target. Enterprise motions with long, complex cycles often justify 1:1 or tighter; SMB and transactional segments can run 6:1 or higher on a scaled, self-serve model. Segment the ratio by motion rather than applying one number org-wide.
Is high SE utilization a good thing? Not on its own. Utilization sustained above 100% is a burnout signal, not a performance badge — it usually means shallow work across too many deals. Read utilization alongside active deals per SE and a quality or outcome metric, so you can tell a genuinely productive team apart from one that's quietly grinding itself out.
What is demo deflection and why does it matter? Demo deflection is the share of demo requests satisfied without a live SE — via recorded demos, interactive demo automation, sandboxes, product tours, or partner-led demos. It's a leverage metric: in the right segments, deflecting standard demos frees SE capacity for discovery, technical validation, and POCs, effectively raising coverage without adding headcount.
How do I use operational metrics to defend SE headcount? Don't lead with a single ratio — that's the trap. Build a segmented coverage model and back it with operational evidence: utilization trends, active deals per SE, request volume per AE, and attachment rate. The argument that wins budget shows what the work costs and where capacity is breaking, not one blunt number leadership can argue against.
This is Part 5 of a 10-part series on PreSales performance measurement, drawn from the PreSales KPI Playbook and hundreds of conversations with solution engineering leaders. The Trusted Advisor Academy helps PreSales teams turn frameworks like this into everyday practice.
About the authors: Tim Brömme and Jan-Erik Jank are the co-founders of SE Rockstars and the Trusted Advisor Academy. Between them they bring 30+ years of enterprise PreSales experience, eight-figure closed deal portfolios, and 350+ solution engineers coached.
This isn't just a training. It's rewiring how your team operates.
100% free | No commitment required


.svg)