
TL;DR
Most KPI rollouts fail not because the metrics are wrong, but because teams try to instrument everything at once. Start narrow: one segment, a handful of KPIs.Every KPI needs three deliberate choices — the right level (individual, team, org), timeframe (weekly, quarterly, annual), and segment (enterprise vs. mid-market). The same metric means different things at different settings.Build a measurement cadence, not a dashboard. Numbers nobody reviews on a rhythm decay into wallpaper.Sequence change with Adoption → Behaviour → Impact (ABI): first people use the system, then their habits shift, then the outcomes move. Skip a stage and the whole thing stalls.Metrics tell you where to improve. Enablement is the engine that actually closes the gap — it's what turns a scorecard into mastery.
Across this series we've built a credible PreSales measurement system — four lenses, a clean Technical Win, paired counter-metrics, instrumented workflows. But a framework on a slide is worth nothing until it survives contact with a real team. And here's the uncomfortable truth from the field: most KPI initiatives don't die from bad math. They die from rollout.
One senior solution engineer at a vertical SaaS company in the DACH region described what adoption actually requires inside a real organisation: "To get this off the ground, you need a sponsor high enough up the food chain who says: I love this topic, I'm doing it. We have plenty of smart people who think they can do everything better themselves — but the need is real, and so is the potential." That's the whole rollout problem in one breath. The metrics aren't the hard part. The change is.
So this finale is about the move from measurement to mastery: how to roll out a PreSales KPI system without drowning your team, in a sequence that actually sticks.
How do you roll out a PreSales KPI system without overwhelming the team?
Start absurdly narrow. Pick one segment and a handful of KPIs — three to five, not fifteen. Prove the system works in a small, well-lit corner of the business before you scale it everywhere.
The instinct is the opposite. Once leadership buys into measurement, the temptation is to instrument the whole org on day one: every region, every deal tier, every metric from the playbook at once. That's how you get a 28-field CRM that SEs quietly route around, dashboards nobody trusts, and a team that experiences "KPIs" as administrative punishment rather than a coaching tool.
Narrow beats comprehensive because it gives you something to learn from. Roll the Technical Win Rate, POC Success Rate, and Compelling Event Quality Score out to your enterprise segment for one quarter. Watch what breaks. Find out which definitions your SEs interpret three different ways. Fix the friction while it's cheap. Then expand. A system that works perfectly for one segment and is trusted is infinitely more valuable than a complete one that everybody games.
Why does each KPI need its own level, timeframe, and segment?
Because a single number means completely different things depending on how you slice it — and getting the slice wrong is how good metrics produce bad decisions. Before any KPI goes live, decide three things: at what level you report it, over what timeframe you read it, and within which segment you benchmark it.
Level — individual, team, or organisation — is the one most likely to blow up in your face. An SE Manager at a developer-tools company in North America drew the line sharply: "If we start having individual tracking, it can turn from a valuable learning opportunity into a micromanagement tracking exercise." Some KPIs (Technical Win Rate, evaluation cycle time) are legitimate individual coaching signals. Others (utilization, attach rate, internal NPS) belong at team or org level, where they describe system health rather than indict a person. Push a system-health metric down to the individual and you manufacture surveillance and fear — and people optimise the number instead of the work.
Timeframe determines whether a metric is signal or noise. A leading indicator like Compelling Event coverage is a weekly pipeline-hygiene read; you act on it now. A lagging indicator like SE-Attached Revenue is a quarterly or annual validation — read it weekly and you'll chase random variance off a cliff.
Segment sets the benchmark. A 1:1 AE:SE ratio is normal in enterprise and wildly expensive in mid-market. A 60% attach rate might be excellent in one segment and alarming in another. The median AE:SE coverage sits around 4:1 globally — but that blended number is useless until you segment it by deal size. Same KPI, different healthy range.
- Level — The question to answer: Coaching signal or system health? · Example: Technical Win Rate → individual; Utilization → team/org
- Timeframe — The question to answer: How fast does it move? · Example: Compelling Event coverage → weekly; SE-Attached Revenue → quarterly
- Segment — The question to answer: What's the right benchmark? · Example: AE:SE ratio: ~1:1 enterprise vs. higher in mid-market
The core metrics for this chapter at a glance.
What is a measurement cadence — and why does it beat a dashboard?
A measurement cadence is a fixed rhythm of reviewing specific metrics with specific people. It beats a dashboard because a dashboard is passive — it waits to be looked at, and mostly isn't. A cadence is a calendar commitment that forces the numbers into a decision.
The cadence is what makes metrics behaviour-changing instead of decorative. Match the rhythm to the metric's timeframe:
- Weekly — leading indicators in deal reviews. Compelling Event quality, MEDDPICC compliance, multi-threading, POC success criteria. The question: which live deals need intervention this week?
- Monthly — operational and qualitative health. Utilization, attach rate, discovery/demo quality scores. The question: is capacity deployed well and is the work getting better?
- Quarterly — lagging outcomes and the strategic story. Technical and SE-Attached Win Rate, SE-Attached Revenue, average deal size with/without SE. The question: did the strategy work, and can we defend the headcount?
Without the cadence, even a beautiful system rots. The numbers drift, definitions blur, and within two quarters you're back to faith-based management.
How do you sequence the rollout so it actually sticks? Adoption → Behaviour → Impact
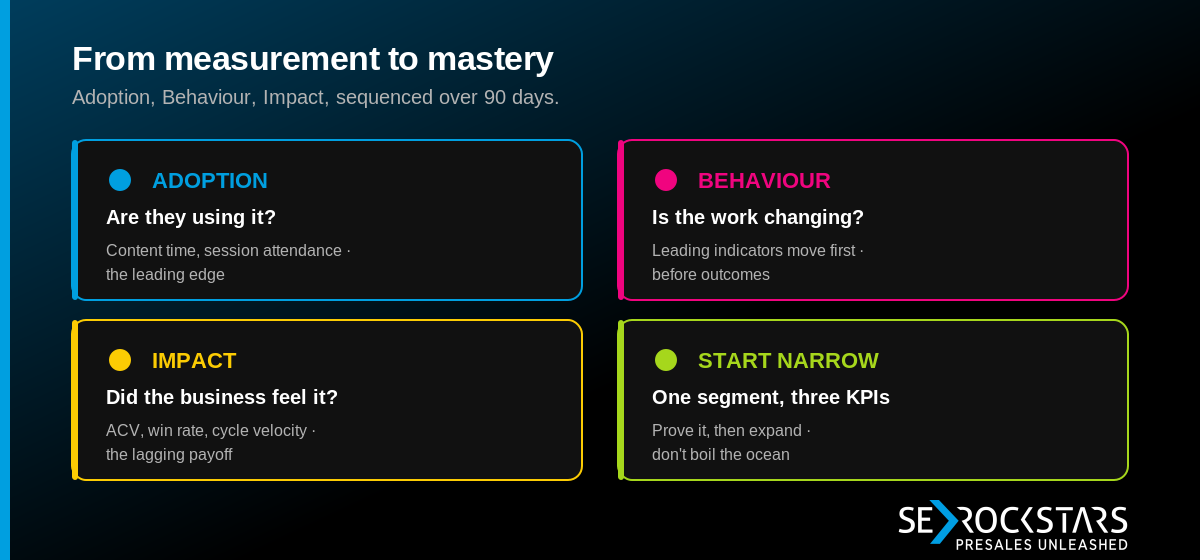
Use the ABI progression: Adoption first, then Behaviour, then Impact. People have to use the system before their habits can change, and habits have to change before outcomes move. Most rollouts fail because they demand impact in week one and panic when the win rate hasn't budged — while adoption is still at 40%.
Adoption is the foundation, and it's fragile. As the playbook warns, "adoption drops because even strong SEs will always prioritize customer-facing work over CRM hygiene." If your KPIs depend on manual data entry, you're measuring tolerance for admin, not performance. So make adoption nearly free: instrument the workflow, capture signal as a by-product of real work, and report a single adoption number first — are people actually using it? Don't even look at outcomes yet.
Behaviour comes next. Once the data is flowing and trusted, the metrics start surfacing in coaching conversations, and habits shift — SEs run deeper discovery because Compelling Event coverage is visible; they set POC exit criteria because the success-metrics field is now standard. This is where a KPI system earns its keep, and it's the stage that benefits most from a manager being close to the work, not just the report.
Impact is last and it's a lagging effect, by definition. Win rate, cycle time, and deal size move after behaviour has changed and held. One SE leader at an enterprise ERP company in North America framed exactly why this sequence is worth the patience: "In my next role, I will approach it much differently — this is non-negotiable because of the value this organization brings to the company. Improvement in velocity, average deal size, or win rates will go up if we put the right skill sets in place." Impact is the promise. ABI is how you keep it.
A concrete 90-day rollout
Here's the whole thing on one page — one segment, a handful of KPIs, a cadence, sequenced as ABI:
Days 1–30 — Adopt (one segment, 3 KPIs). Choose your enterprise segment. Stand up Technical Win Rate, POC Success Rate, and Compelling Event Quality Score — instrumented from the workflow, not hand-typed. Secure the executive sponsor. Success metric: adoption rate, nothing else. Are SEs and managers using the system at all?
Days 31–60 — Shift behaviour. Start the weekly deal-review cadence on the leading indicators. Bring the three KPIs into coaching one-to-ones — at the right level (Technical Win as an individual signal; coverage as a team read). Don't expect outcomes to move yet. Watch for habit change: deeper discovery, defined POC exit criteria, cleaner multi-threading.
Days 61–90 — Read early impact, then expand. Run the first quarterly review on lagging outcomes for the pilot segment. Compare against the segment's own baseline. Capture what broke, refine the definitions — then extend the system to the next segment with everything you learned. Repeat the ABI loop; don't restart it.
Why enablement is the engine that turns metrics into mastery
Here's the closing point of the entire series. A KPI system is a diagnostic. It tells you, with precision, where a team is strong and where it's leaking — weak discovery, generic demos, no quantified cost of inaction, POCs without exit criteria. What it cannot do is fix any of that.
Metrics measure the gap. Enablement closes it. A low Technical Win Rate is a coaching agenda, not a verdict. A thin Compelling Event score is a discovery skill to build, not a number to shame. The whole point of measuring well is to know exactly where to point the development — and then to actually do it, on a rhythm, until the behaviour holds and the impact lands. That's the difference between a team that has a dashboard and a team that operates at the front of the field.
Measurement without enablement is just a more precise way to watch a team underperform. Put the two together and you get the thing every PreSales leader is actually after: not a prettier scorecard, but mastery.
Frequently asked questions
How long does it take to roll out a PreSales KPI system? Plan for a 90-day pilot in one segment, then expand. The first 30 days are pure adoption (people using the system), the next 30 shift behaviour through a weekly cadence, and the final 30 read early impact. Outcomes like win rate move later — they're lagging by nature. Resist scaling until the pilot is trusted.
Should PreSales KPIs be tracked at the individual or team level? Both, but deliberately. Coaching signals like Technical Win Rate and evaluation cycle time work at the individual level. System-health metrics like utilization, attach rate, and internal NPS belong at team or org level. Pushing a system-health metric onto individuals turns enablement into surveillance and pressures people to game the number.
What is the Adoption–Behaviour–Impact (ABI) model? ABI is a rollout sequence: first people adopt the system, then their behaviour changes, then outcomes improve. Each stage depends on the one before it. Demanding impact before adoption and behaviour have landed is the most common reason KPI rollouts stall — the numbers can't move until the habits do.
Do managers need to be involved in the rollout, or just review reports? Closely involved. As one SE manager at a developer-tools company in North America put it, the value of joining is "having as much context as possible about what my team is going through, so I can help build the momentum, leverage it in coaching conversations, and observe in real environments how they are applying the learnings." Reports show outcomes; presence drives the behaviour change underneath them.
This is the final part of a 10-part series on PreSales performance measurement, drawn from the PreSales KPI Playbook and hundreds of conversations with solution engineering leaders. If you've followed the whole arc — the metrics gap, the four lenses, KPI pairing, instrumentation, and now rollout — you already have the blueprint. The Trusted Advisor Academy is where PreSales teams turn that blueprint into everyday practice: it's the enablement engine that moves a team from measurement to mastery.
About the authors: Tim Brömme and Jan-Erik Jank are the co-founders of SE Rockstars and the Trusted Advisor Academy. Between them they bring 30+ years of enterprise PreSales experience, eight-figure closed deal portfolios, and 350+ solution engineers coached.