
Leading Indicators: Predicting Wins Before They Happen

TL;DR
- Lagging metrics tell you the quarter is lost after it's already lost. Leading indicators tell you while there's still time to fix it.
- The best predictors of a Technical Win aren't activity counts — they're deal-quality signals: compelling event quality, MEDDPICC compliance, stakeholder coverage, cost-of-inaction documentation, POC success criteria, and a live Mutual Action Plan.
- These six aren't a wishlist. They're a forward-looking dashboard you can inspect mid-quarter and act on this week.
- The most underdeveloped skill in PreSales is putting a credible number on the cost of doing nothing — and it's also one of the strongest urgency signals you have.
- A leading indicator is only useful if it triggers a coaching conversation before the deal stalls. Measure the signal, then intervene.
"I'd rather us be involved earlier and qualify out on the right deals," a solution engineering leader at an enterprise cybersecurity company in the UK told us. "We used to have like ridiculous gates to get to the SE. I do want to put some gates up, but what I keep saying is I'd rather us be involved earlier and qualify out — and stay in the right deals."
That instinct — get in early, read the signals, decide what's real before you've poured weeks into it — is the entire logic of leading indicators. By the time a deal shows up as a win or a loss in your CRM, the decisions that determined the outcome were made months earlier. Leading indicators surface those decisions while you can still change them. They're the difference between managing the quarter and explaining it.
What is a leading indicator in PreSales?
A leading indicator is a predictive signal — a measurable property of a live deal that correlates with whether it will close, captured early enough to act on. Lagging indicators (win rate, revenue, average deal size) tell you what already happened. Leading indicators tell you what's about to happen, while there's still room to intervene.
For Sales Engineering, the useful ones focus on deal quality, process adherence, and technical intent — not volume. Demos delivered is not a leading indicator; it's an activity count that says nothing about whether any of those demos sit on qualified deals. The right signals answer a sharper question: of the deals my team is working right now, which ones are real, and which ones are quietly drifting toward no-decision?
That distinction matters because activity hides risk. An SE running at 110% capacity on thin opportunities looks productive on every dashboard you own — right up until the quarter closes empty. Leading indicators are how you see the thinness before it costs you.
Which leading indicators actually predict a PreSales win?
Six signals do most of the work. Each is a property you can check on any open opportunity, and each maps to a specific failure mode you'd otherwise only discover at close.
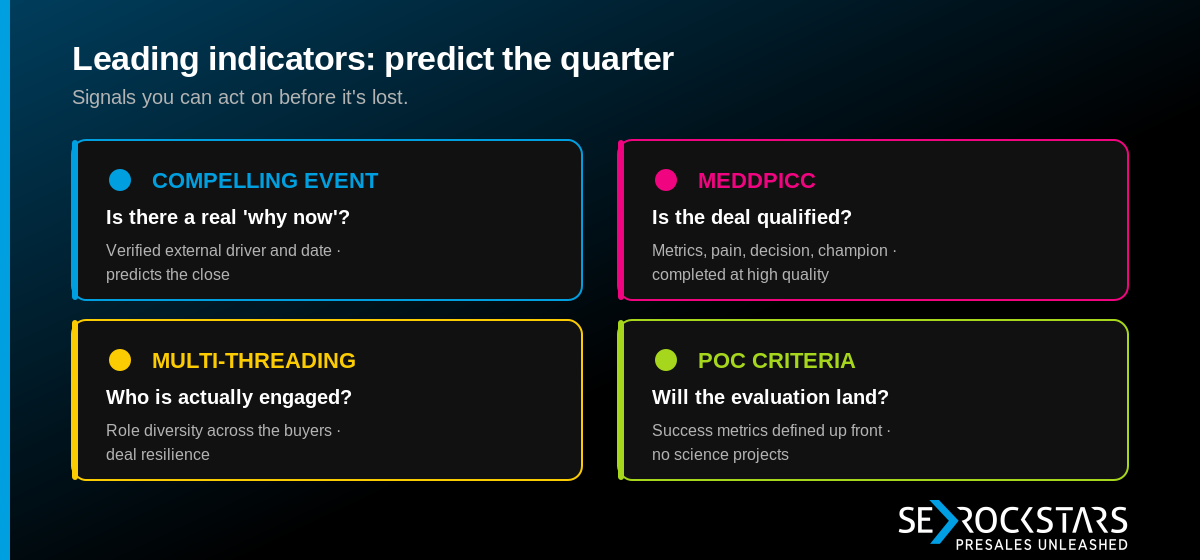
1. Compelling Event Quality Score (incl. MEDDPICC compliance). Is there a real, dated business reason to act now — a deadline, a contract expiry, a regulatory trigger — and is the deal qualified against a discipline like MEDDPICC? A deal with no compelling event isn't a deal; it's an interesting conversation that will slip.
2. Customer Stakeholder Coverage (Multi-Threading Score). How many distinct customer-side roles are actively engaged — business owner, economic buyer, IT/security, procurement, end users, operations — with at least one meaningful interaction logged each? Single-threaded deals are fragile: one champion leaves and the whole opportunity evaporates. Higher coverage speeds consensus and raises close probability.
3. Cost of Inaction Coverage (COI%). What percentage of your active deals have a documented, quantified cost of doing nothing — lost revenue, wasted spend, risk exposure, productivity drag? This is a depth-of-discovery and urgency signal. Low COI coverage is a reliable predictor of deals that drag out and die in discounting or no-decision.
4. POC Success Metrics Coverage. What percentage of your POCs and trials have clear, measurable success criteria — metric, target, owner, measurement method — documented before the evaluation starts? Without them, evaluations turn into open-ended science projects the customer can stretch indefinitely.
5. Portfolio / ROI Coverage. Is there a documented business case — inputs, assumptions, timeframe, quantified upside — attached to the deal? High coverage signals value has been quantified and socialized, which raises urgency and reduces discounting. Low coverage flags feature-led deals that stall in approval.
6. Mutual Action Plan (MAP) Coverage. Is there a shared plan with milestones, owners on both sides, and dates running through signature and kickoff? A live MAP is a control-and-momentum metric: it converts "we'll circle back" into mutual accountability with a date on it.
Read together, these six form a forward-looking dashboard. You don't need all of them at maximum on every deal — you need to know which are missing on which deals, because each gap is a specific coaching conversation.
The signal most teams skip: cost of inaction
Of the six, one is both the highest-leverage and the most neglected. After coaching 350+ SEs, we keep seeing the same gap: the single most underdeveloped skill in PreSales is putting a credible estimate on the cost of doing nothing.
It's understandable. Many SEs are hesitant to talk real numbers with customers — even mild pushback from a prospect is enough to make them retreat to "that's the AE's job." But that retreat is expensive. When a customer clearly understands what inaction is costing them every month, decisions happen faster. COI is the foundation of genuine value-based selling, and it's a leading indicator precisely because it predicts urgency — and urgency predicts close.
This is why qualification depth shows up again and again as a frontline pain. One SE leader at a cybersecurity vendor in the UK & Ireland described how weak upstream qualification floods the team with deals nobody wants to call:
"We have a lot of pipeline that comes to us because of the breadth of portfolio that we have. So because of that volume, the reps have a problem saying no. So then they lean on their SE and then when we see it and they go yeah this looks good and we go eh, everyone thinks oh now the SEs are being negative, they don't want to do this opportunity."
When the only tool you have to spot a bad deal is an SE's gut feeling — voiced as a reluctant "eh" — you've got no leading indicator at all, just friction. Document COI, stakeholder coverage and success criteria as fields, and "this deal is thin" stops being an opinion the SE has to defend and becomes a number everyone can see.
Leading indicators are an early-warning system, not a report card
The whole point is to act before the outcome is set. A leading indicator you only review at quarter-end is just a slow lagging indicator.
Take POC success criteria. An SE manager at a cybersecurity company in the DACH region named exactly what goes wrong when they're missing:
"What is really missing in POCs are binding test scenarios — test cases that you actually work through. Some customers get the feeling they can stretch the POC out indefinitely. And those are the moments where I just step in and say: not like this."
Notice the move: he intervenes. That's leading indicators working as designed. "POC has no documented success criteria" is a flag you can catch in week one, not a post-mortem you write in week ten. The metric exists to trigger the step-in.
The same logic scales up to whole-deal foresight. Another solution engineering leader, this time at an enterprise cybersecurity vendor in the German-speaking DACH market, described losing deals to competitors who simply did the predictive work first:
"We lack long-term foresight. And that short-sightedness often means competitors move in, because they've already pre-qualified: when do strategic contracts expire? Who are the vendors? Who are the partners? What actually drives the customer? What are the political dynamics? All of that is completely missing on our side."
Every question in that quote is a leading indicator. Contract expiry is a compelling event. Vendors and partners and political dynamics are stakeholder coverage. "What actually drives the customer" is cost of inaction. The competitor isn't smarter — they're just measuring the predictors and acting on them while there's runway left.
A benchmark and a simple formula
You don't need a data-science project. Start by instrumenting two fields and tracking coverage across your open pipeline.
Cost of Inaction Coverage (COI%):
COI% = (Open deals with a documented, quantified cost of inaction)
       ÷ (Total open deals)  × 100
POC Success Metrics Coverage:
POC Coverage% = (POCs with success criteria defined BEFORE start)
                ÷ (Total active POCs)  × 100
A reasonable starting benchmark for a maturing team: aim for COI documented on at least 70% of your qualified pipeline, and success criteria on 100% of POCs before they begin — the POC bar should be non-negotiable, because a POC without criteria is a deal you've already partly lost. Most teams that measure this for the first time discover their real numbers are far lower than they assumed. That gap is the finding. Track the trend monthly, and pair each metric with the intervention it implies: low COI → coach value discovery; low POC coverage → no evaluation starts without a signed success plan.
Frequently asked questions
What's the difference between a leading and a lagging indicator in Sales Engineering? A lagging indicator (win rate, revenue, average deal size) measures an outcome after it's happened. A leading indicator (compelling event quality, COI coverage, POC success criteria) measures a property of a live deal that predicts that outcome — early enough to change it. Leading indicators let you manage the quarter, not just report on it.
What is Cost of Inaction Coverage (COI%) and why does it matter? COI% is the share of open deals with a documented, quantified cost of doing nothing — lost revenue, wasted spend, risk exposure. It's both a discovery-depth and an urgency signal. High coverage predicts momentum and fewer no-decisions; low coverage flags "interesting but not urgent" deals that drag out and end in discounting.
How does multi-threading predict whether a deal will close? Stakeholder coverage measures how many distinct customer roles are actively engaged with logged interactions. Single-threaded deals are fragile — if your one champion leaves, the deal collapses. Broader coverage reduces that risk, speeds internal consensus, and consistently correlates with higher close rates, which is why it's a core deal-resilience metric.
Why should POC success criteria be defined before the evaluation starts? Because criteria defined afterward aren't criteria — they're rationalizations. Documenting the metric, target, owner, and measurement method up front prevents open-ended "science projects," gives you a clean go/no-go decision, and stops customers from stretching the POC indefinitely. It's one of the strongest leading indicators of POC conversion.
This is Part 3 of a 10-part series on PreSales performance measurement, drawn from the PreSales KPI Playbook and hundreds of conversations with solution engineering leaders. The Trusted Advisor Academy helps PreSales teams turn leading indicators like these into everyday coaching habits rather than quarter-end regrets.
About the authors: Tim Brömme and Jan-Erik Jank are the co-founders of SE Rockstars and the Trusted Advisor Academy. Between them they bring 30+ years of enterprise PreSales experience, eight-figure closed deal portfolios, and 350+ solution engineers coached.
This isn't just a training. It's rewiring how your team operates.
100% free | No commitment required


.svg)