
Lagging Indicators: Proving PreSales Revenue Impact

TL;DR
- Lagging indicators are the SE organization's scorecard — they prove the return on PreSales investment and are what you take into a budget or headcount fight.
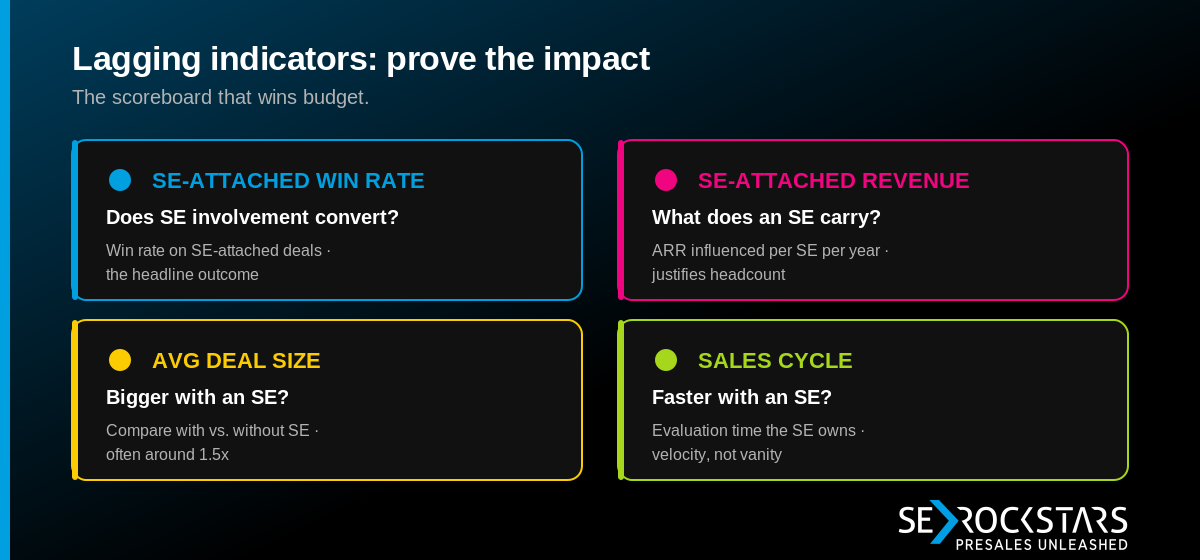
- Four numbers carry the argument: SE-Attached Revenue (ARR per SE), Average Deal Size with vs. without SE, PreSales Influence Rate, and Sales Cycle Length.
- The benchmarks are real and quotable: SE-supported deals run roughly 1.5x larger, and orgs at a 1:1 SE-to-rep ratio average $3.2M revenue per rep vs. $2M at 1:5.
- A spreadsheet alone loses the argument. What wins budget is a system that links SE involvement to deal outcomes the CFO already cares about.
- These numbers validate strategy, not behavior — pair them with leading indicators (Part 3) or you'll optimize for big ARR while burning the team out.
Ask an SE leader to defend their investment in the team and you'll hear a confession. Here's one a former global PreSales leader at an enterprise ERP company in North America shared with us: "As a manager, I want to develop my team … and a lot of times the question is: how do I actually go out and get budget for this? Am I business-savvy enough to position a business case? Looking back, there was plenty of money — I just didn't know how to go and position a business case to get it done."
The money was there. The will was there. What was missing was the ability to make the case in the language leadership funds. And that gap — between deserving the investment and being able to argue for it — is what lagging indicators exist to close. Leading indicators (Part 3) tell you which deals will close. Lagging indicators tell you what the SE team actually delivered, in the only currency leadership reflexively trusts: revenue. Get them right and you stop defending your team as a cost and start presenting it as a multiplier.
What are lagging indicators in PreSales?
Lagging indicators are outcome metrics — they measure what already happened, after the deal closed. You can't influence them in the moment the way you can a leading indicator; by the time they're reported, the quarter is done. What they do instead is validate strategy, justify headcount, and inform compensation.
That makes them the wrong tool for in-flight coaching and exactly the right tool for the annual budget conversation. When finance asks what the SE organization returns on its considerable cost, "we ran 400 demos" is not an answer — it's an admission you've been counting the wrong thing. Four lagging indicators answer the question properly, and the rest of this post takes each in turn.
How do I prove the ROI of my SE team to leadership?
Start with the metric that translates SE capacity directly into money: SE-Attached Revenue — the total closed-won ARR from opportunities where an SE was formally attached and meaningfully engaged, usually normalized per SE.
The formula is deliberately blunt:
SE-Attached Revenue = Σ closed-won ARR (SE-attached, in period)
ARR per SE          = SE-Attached Revenue ÷ Avg. # of SE FTEs (same period)
A worked example: 38 closed-won opportunities had an SE attached last quarter, totaling €4.75M. With 8 SE FTEs, that's €594K ARR per SE for the quarter. Now you have a number that scales — and a basis for saying "another SE forecasts roughly this much additional capacity."
The external anchor that lands in a leadership room comes from Alexander Group: sales orgs at a 1:1 SE-to-rep ratio average $3.2M revenue per rep, versus $2.0M at 1:5. Higher SE coverage correlates with higher rep productivity. That's the underlying logic behind every "revenue per SE" conversation — and it reframes the AE-to-SE ratio from a cost line into a productivity lever.
One guardrail: define "attached" as meaningful engagement — a customer-facing activity or technical milestone, with a recorded first-engagement date. The fastest way to discredit this metric is to let SEs attach late to everything just to claim the revenue. The moment leadership smells credit inflation, the whole scorecard loses its authority.
Are SE-supported deals actually bigger?
Yes — and this is often the strongest part of the argument. Average Deal Size with vs. without SE compares the average contract value of SE-involved deals against those without, expressed as a delta (+€X) or a ratio (1.5x).
The commonly cited figure is that SE-attached deals run about 1.5x the size of self-service deals; in segmented data the gap is frequently wider. One quarter we modeled: 20 SE-attached closed-won deals averaged €120K, while 60 deals without SE averaged €50K — a €70K uplift, a 2.4x difference.
ADS (SE-attached) = Σ deal value (SE deals) ÷ # SE deals
ADS (No SE)       = Σ deal value (non-SE deals) ÷ # non-SE deals
Uplift            = ADS (SE-attached) − ADS (No SE)
Ratio             = ADS (SE-attached) ÷ ADS (No SE)
This is where the smart money goes. An SE manager at an HR Tech company in North America put the strategic case better than any deck could:
"Value selling lives in the middle bucket of win rate improvement. But as a business, if we can improve deal sizes, I think the upside is larger than incremental win rate gains."
That's the whole argument for investing in PreSales in one sentence. Win-rate gains are incremental and capped. Deal-size expansion compounds across the entire book. If your team can reliably make deals bigger, the ROI case writes itself — and "average deal size with vs. without SE" is the number that proves it.
Two honest caveats. First, segment it (SMB / mid-market / enterprise, new vs. expansion) — "with SE" usually means "more complex by design," so an unsegmented number flatters you. Second, watch the trend: if average deal size with SE drifts down toward without SE, you're over-serving small deals and quietly destroying your own ROI. The metric is a governance signal as much as a bragging right.
What is the PreSales Influence Rate, and what should it be?
PreSales Influence Rate is the percentage of closed-won deals that had an SE formally attached and actively engaged. It's tempting to chase a high number here — resist that.
The counterintuitive truth: the goal is not "as high as possible." A healthy influence rate is high on complex, enterprise deals and low on simple, repeatable ones. If your SEs are attached to 95% of everything, including transactional SMB deals that close themselves, you don't have great coverage — you have misallocated capacity and a team headed for burnout.
Read alongside SE-Attached Win Rate and deal complexity, Influence Rate validates right coverage: SEs on the deals that genuinely need them, not accidental over-attachment or late engagement for credit. It's the metric that keeps the other three honest.
Does PreSales involvement speed up or slow down deals?
Both answers are defensible, which is exactly why Sales Cycle Length needs handling with care. SE involvement can lengthen the technical evaluation (a real POC takes time) while shortening the overall cycle (fewer false starts, cleaner technical sign-off, less back-and-forth).
So isolate the part the SE owns: the Average Evaluation Cycle Time — from the start of deep evaluation (POC kickoff, formal technical discovery) to technical sign-off. If a typical six-month cycle includes two months of technical validation, that two-month window is what SE process improvements actually move. Track that sub-metric, and "is PreSales slowing us down?" becomes a question you can answer with data instead of vibes.
The ambition that ties all four metrics together came from a North American SE leader at an enterprise ERP company, describing how they'd run things next time:
"In my next role, I will approach it much differently — this is non-negotiable because of the value this organization brings to the company. Improvement in velocity, average deal size, or win rates will go up if we put the right skill sets in place."
Velocity, deal size, win rate. Those are the three lagging outcomes that move when PreSales is treated as an investment rather than a support function. The leaders who win the budget fight are the ones who can show that movement — not assert it.
The trap: lagging indicators are a scorecard, not a steering wheel
Here's the discipline. Lagging indicators are powerful precisely because they're commercial and concrete — and dangerous for the same reason. Optimize them in isolation and you get predictable damage: teams chase high-ARR whales regardless of fit, one big deal flatters the average while fundamentals rot, and "won" revenue turns into early churn six months later.
So report by segment and watch the distribution, not just the average. Counterbalance revenue metrics with downstream health signals — early-stage churn, time-to-first-value, handoff quality. And never present a lagging number without the leading indicators (Part 3) that explain why it moved. A strong technical win that still lost commercially isn't an SE failure — it's a pricing conversation. The scorecard tells you what happened. The leading indicators tell you what to do about it.
That's the difference between the leader who walks into the budget review with a spreadsheet and walks out with nothing, and the one who walks in with a system. Same data. Different outcome.
Frequently asked questions
How do I prove the ROI of my SE team to leadership? Lead with SE-Attached Revenue (ARR per SE) and Average Deal Size with vs. without SE. Anchor it externally: orgs at 1:1 SE-to-rep average $3.2M per rep vs. $2M at 1:5, and SE deals run ~1.5x larger. The system linking SE involvement to outcomes wins budget — not a standalone spreadsheet.
What is the difference between SE-Attached Revenue and Average Deal Size? SE-Attached Revenue is total closed-won ARR from SE-supported deals, often per SE — it sizes the team's overall revenue footprint. Average Deal Size with vs. without SE isolates the uplift SE involvement creates per deal. The first proves scale; the second proves causation. Use them together.
Should PreSales Influence Rate be as high as possible? No. The right level is high on complex enterprise deals and low on simple, repeatable ones. A near-total influence rate usually signals over-attachment and misallocated capacity, not strength. Read it alongside deal complexity and SE-Attached Win Rate to validate coverage, not to maximize a vanity number.
Doesn't SE involvement just make sales cycles longer? It can lengthen the technical evaluation while shortening the overall cycle through cleaner sign-off and fewer false starts. Isolate Average Evaluation Cycle Time — the SE-owned window from POC start to technical sign-off — so you measure the part PreSales actually controls rather than blaming the whole cycle on the team.
This is Part 4 of a 10-part series on PreSales performance measurement, drawn from the PreSales KPI Playbook and hundreds of conversations with solution engineering leaders. The Trusted Advisor Academy helps PreSales teams turn frameworks like this into everyday practice.
About the authors: Tim Brömme and Jan-Erik Jank are the co-founders of SE Rockstars and the Trusted Advisor Academy. Between them they bring 30+ years of enterprise PreSales experience, eight-figure closed deal portfolios, and 350+ solution engineers coached.
This isn't just a training. It's rewiring how your team operates.
100% free | No commitment required


.svg)