
The North Star: SE-Attached & Technical Win Rate


TL;DR
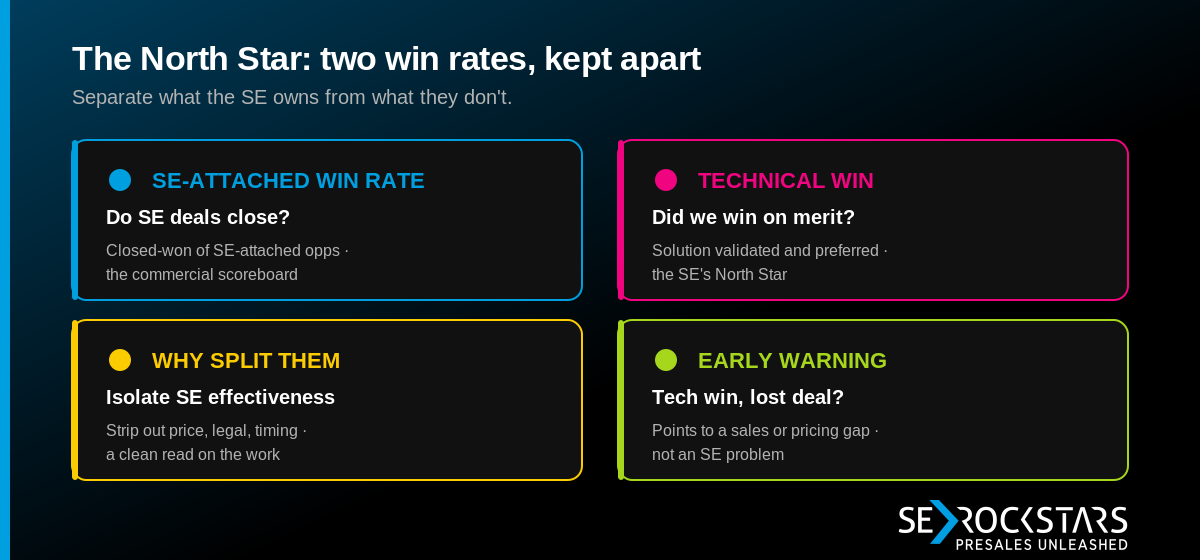
- The Technical Win Rate is the single best North Star for a PreSales team: it measures the outcome the SE actually owns, and it predicts the commercial win without being hostage to it.
- Run two numbers, not one. SE-Attached Win Rate is the lagging scoreboard (did the deal close?); Technical Win Rate is the quality signal (did we prove the solution fits, regardless of how the deal ended?).
- The gap between the two is your most valuable diagnostic. High technical win + low commercial win means you have a pricing or sales problem — not an SE one.
- Real benchmarks: aim for 70–90% technical win on qualified evaluations; below ~50% is a red flag. Meanwhile roughly half of all POCs fail to convert, so the denominator matters.
- Define "technical win" precisely — customer-confirmed success criteria, not "that demo went well" — or the metric gets gamed into meaninglessness.
"The goal is to make clear that PreSales is not just the demo monkey," a solution engineering leader at a vertical SaaS company in the DACH region told us, describing a team that ranges from someone who shows a tool quickly and hands out 20 licenses, to "enterprise solutions where 3 or 4 people work together, a 3–4 year sales cycle, complex processes, and multi-week workshops at the customer site." Same job title, wildly different value — and most scorecards can't tell the two apart.
That gap is the entire argument for this article. The SE owns a milestone they can win cleanly — proving the solution fits — and then gets scored on a commercial outcome decided later, in a room they aren't in, on terms they don't control. The fix isn't to throw out win rate. It's to run the right win rate as your North Star: one that rewards the trusted advisor, not just the demo doer. Let's build it.
What should a PreSales team's North Star metric actually be?
The Technical Win Rate. It's the percentage of evaluated deals where the prospect confirms your solution met their requirements and was the preferred technical fit — even if the deal later stalls on budget, timing, or procurement. It isolates the SE's contribution by stripping out everything the SE doesn't control.
This is the move that makes PreSales measurement fair. Win rate alone folds in pricing, legal, and discounting the SE never touched. Activity counts (demos delivered) measure motion, not contribution. The Technical Win sits exactly in between — it's downstream of real work, upstream of the close.
The role has earned this metric. Historically the SE was support staff, so we measured utilization — are my people busy? Today the SE is a strategic partner who owns the Technical Win: the point where a prospect confirms the solution beats the competition. When the role changed, the scorecard should have changed with it. For most teams, it didn't.
So the manager's question shifts. Not "are my people busy?" but "are my people winning the deals that need winning, and proving fit when it counts?" The Technical Win Rate is the cleanest answer to that question you can put on a dashboard.
What is the difference between SE-Attached Win Rate and Technical Win Rate?
They answer two different questions, and you need both. SE-Attached Win Rate is the commercial scoreboard: of the qualified opportunities an SE worked, how many closed-won? Technical Win Rate is the quality signal: of the deals that reached a technical evaluation, how many did the SE win technically, regardless of the final commercial result?
The formulas are simple and you should write them on the wall:
SE-Attached Win Rate = Closed-Won (SE-attached) / (Closed-Won + Closed-Lost, SE-attached)
Technical Win Rate = Technical Wins / Technical Evaluations undertaken
Here's why running both beats running either. Imagine a quarter with 40 evaluated deals. In 30, the customer confirmed the solution met all their requirements — that's a 75% technical win rate. But only 20 actually closed commercially. The other 10 technical wins fell through on budget or timing.
Read those two numbers side by side and the story writes itself: a 50% commercial win on evaluated deals, but a 75% technical win. The SE team did its job in three out of four cases. The losses weren't about product fit. That's a conversation you can only have when you measure the two separately — and it points coaching at sales and pricing instead of unfairly at the SE.
Why is the gap between the two numbers your most valuable signal?
Because the gap tells you where the deal is actually breaking. A healthy technical win rate paired with a sagging commercial win rate is not an SE problem — it's an early-warning light pointing at pricing, packaging, or late-stage sales execution. Diagnose it as an SE problem and you'll coach the wrong person into the ground.
The opposite gap is just as informative. A low technical win rate means the breakage is upstream: weak discovery, a real product gap, poorly qualified evaluations, or demo execution that isn't landing. That's squarely in the SE org's lane, and it's fixable with the right intervention.
An SE manager at an HR tech company in North America framed the strategic stakes well: "Value selling lives in the middle bucket of win rate improvement. But as a business, if we can improve deal sizes, I think the upside is larger than incremental win rate gains." His point reinforces ours — win rate is one lever, not the whole game. (Part 3 takes deal size head-on.) But you can only reason about which lever to pull once you've separated the technical outcome from the commercial one.
This is also how PreSales escapes the "matter of faith" trap. "Our teams are technically very strong," an SE manager at an enterprise cybersecurity company in the DACH region told us, "but they very quickly fall into a default demo mode or default POC mode. That works fine on the admin and IT side, but at the C-level I would like us to talk more about business outcomes and business value, to create the trusted advisor perception with the customer." A clean Technical Win Rate is what makes that shift visible: it rewards the SE who proves business fit, not just the one who runs a slick demo — and it survives a budget review.
What is a good Technical Win Rate?
Aim for 70–90% on qualified evaluations. High-performing SE teams cluster there. If you're below ~50%, treat it as a red flag — you're either running POCs on long-shot deals or your product genuinely isn't meeting needs. One team we know moved their technical win from 61% to 74% purely by tightening discovery and solution alignment.
But watch the ceiling too. A team sitting at 95%+ isn't necessarily elite — they may be declaring "win" too loosely, or only engaging in deals they're certain to win, which means they're leaving stretch opportunities on the table. Calibrate against your own history and segment.
And segment honestly. Competitive bake-offs should run lower — maybe 50–60% in a two-vendor fight — while non-competitive evaluations should sit above 80%. A single blended number hides exactly the dynamics you most need to coach.
And remember why you're calibrating at all: improvement in velocity, average deal size, and win rate all follow from putting the right skill sets in place. That's the whole thesis of measuring the Technical Win — it makes the link between SE skill and revenue outcome legible enough to invest against.
Why does the denominator decide whether this metric is honest?
Because a win rate is only as trustworthy as the deals you count in it — and the most common way to lie to yourself is to quietly shrink the denominator. Define "technical evaluation" loosely and SEs can cherry-pick, sandbag, or declare victory early to keep the number pretty.
Two disciplines keep it honest.
Define the technical win as customer-confirmed, not SE-felt. A "promising demo" is not a technical win. The standard should be explicit: the customer signed off that the solution met or exceeded all success criteria in the evaluation. Without that bar, one SE's "win" is another's "maybe," and the metric rots into noise.
Respect the POC reality. Roughly half of all proof-of-concept evaluations fail to convert. A team can be relentlessly busy running POCs and still leak pipeline because the qualification underneath was thin. So count every evaluation that started — not just the flattering ones — and pair the metric with POC success-criteria coverage so you're not running "science projects" without exit criteria.
Get the denominator right and the Technical Win Rate becomes the most defensible number in your stack. Get it wrong and it's just another vanity metric wearing a lab coat.
Frequently asked questions
What is a good technical win rate for an SE team? Target 70–90% on qualified technical evaluations; that's where high-performing PreSales teams cluster. Below roughly 50% signals a problem — usually poor qualification, a product gap, or weak demo execution. Above 95% can mean you're only engaging in sure-thing deals. Always segment competitive bake-offs (often 50–60%) from non-competitive evaluations (80%+).
What is the difference between technical win rate and SE-attached win rate? SE-Attached Win Rate counts how many SE-supported deals closed-won commercially. Technical Win Rate counts how many evaluated deals the SE won technically — the customer confirmed the solution fit — regardless of the commercial result. The first is the scoreboard; the second isolates SE effectiveness. Tracking both, and the gap between them, is what makes the system useful.
How do you define a technical win in the CRM? Use a precise, customer-confirmed standard: the prospect signed off that your solution met or exceeded all agreed success criteria in the evaluation. Capture it as a checkbox, stage, or date field on the opportunity, ideally with the success-criteria document linked. Avoid vague triggers like "good demo" — undefined criteria let the metric drift and get gamed.
Why does my SE team have a high technical win rate but a low commercial win rate? That gap usually means the deals are sound technically but breaking on price, timing, budget, or late-stage sales execution — not on SE performance. It's a signal to look at pricing, packaging, and the commercial close, not to coach your SEs harder. This is the exact diagnostic that separating the two win rates gives you.
This is Part 2 of a 10-part series on PreSales performance measurement, drawn from the PreSales KPI Playbook and hundreds of conversations with solution engineering leaders. The Trusted Advisor Academy helps PreSales teams turn a clean Technical Win Rate from a slide into an everyday habit.
About the authors: Tim Brömme and Jan-Erik Jank are the co-founders of SE Rockstars and the Trusted Advisor Academy. Between them they bring 30+ years of enterprise PreSales experience, eight-figure closed deal portfolios, and 350+ solution engineers coached.
This isn't just a training. It's rewiring how your team operates.
100% free | No commitment required


.svg)